

Does Tether Printing Increase BTC Prices? - Aludra April 29 Newsletter
Does Tether Printing Increase BTC Prices? - Aludra April 29 Newsletter
A closer look at how Tether issuance impacts BTC prices, updates on our engineering, and more.


Welcome back, we hope this newsletter finds you in good health and sound mind during these difficult times. In this weeks edition, we look into Tether, the infamous stablecoin criticized for allegedly facilitating the 2017 BTC run up. Tether issuance is up 55% this year, so BTC prices surely will follow… right? We reviewed a years worth of Tether issuance to put this hypothesis to the test.
Updates from Aludra:
Market Making: We have had a significant amount of interest from exchanges and venues to work together which has been great. We expect to have our market making strategies testing live in the coming weeks.
Mining: We have continued to assess opportunistic deals to be involved in the mining space. Interest has been high and coming from some surprising parties. We expect to have exciting updates on this front by the end of May, just in time for the halvening.
Website: We expect to have our new website live in the next two weeks.
Main Analysis: Does Tether Printing Increase BTC Prices?
Date Written: April 26, 2020
Do you know which crypto-asset has the most trading volume on any given day? It’s not Bitcoin.
It’s Tether (known by the symbol USDT), the ‘dollar-backed’ stablecoin issued by an affiliate company of the crypto exchange Bitfinex. As a fiat collateralized stablecoin, each individual unit of Tether is listed on exchanges as an asset valued at $1.00 USD. No matter the volume, supply rate, or market capitalization, a single USDT is generally $1.00 USD (price fluctuations can and have occurred due to more/less demand among other reasons). USDT was created to facilitate the transfer of fiat currencies and to provide traders a ‘stable’ alternative to Bitcoin as the value of a single Tether is expected to remain consistent ($1.00), most specifically for exchanges that had not developed relationships yet with US banking institutions as to allow their customers to trade into USD.
In this article, we’re going to evaluate the impact that Tether has on the price of Bitcoin and put to the test the common refrain that “more Tethers” means Bitcoin will go up. (examples: “Tether’s Growing Market Cap Is Ultra Bullish for Bitcoin”, “Tether’s Supply Is Exploding. Is This Bullish for Bitcoin?”)
To say Tether has an impact on crypto would be an understatement. While stablecoin usage is growing across the myriad of stablecoins in existence (USDC, Paxos Standard, Multi-collateral DAI, Binance USD, Gemini Dollar, etc), Tether is the largest, and it’s not even close. Year to date, Tether has a reported (by CoinMarketCap.com) average daily volume around ~$45b per day (compared to $36b for Bitcoin). By comparison, the second largest stablecoin by volume, USD Coin, or USDC, has a reported year to date daily average volume of ~$711m, or about ~1.5% of Tether’s daily reported volume.
Few disclaimers: It’s important to note that the volume reported by CoinMarketCap.com has been disputed by some and that, on a whole, actual crypto volumes are much lower if you account for what some data aggregators and commentators call ‘washtrading’ (link here). To their credit, CoinMarketCap.com provides both “reported” and “adjusted” volumes (though their historical data seems to only provide the reported volume). When you look at the top exchanges trading a USDT pair, this theory has some validity:
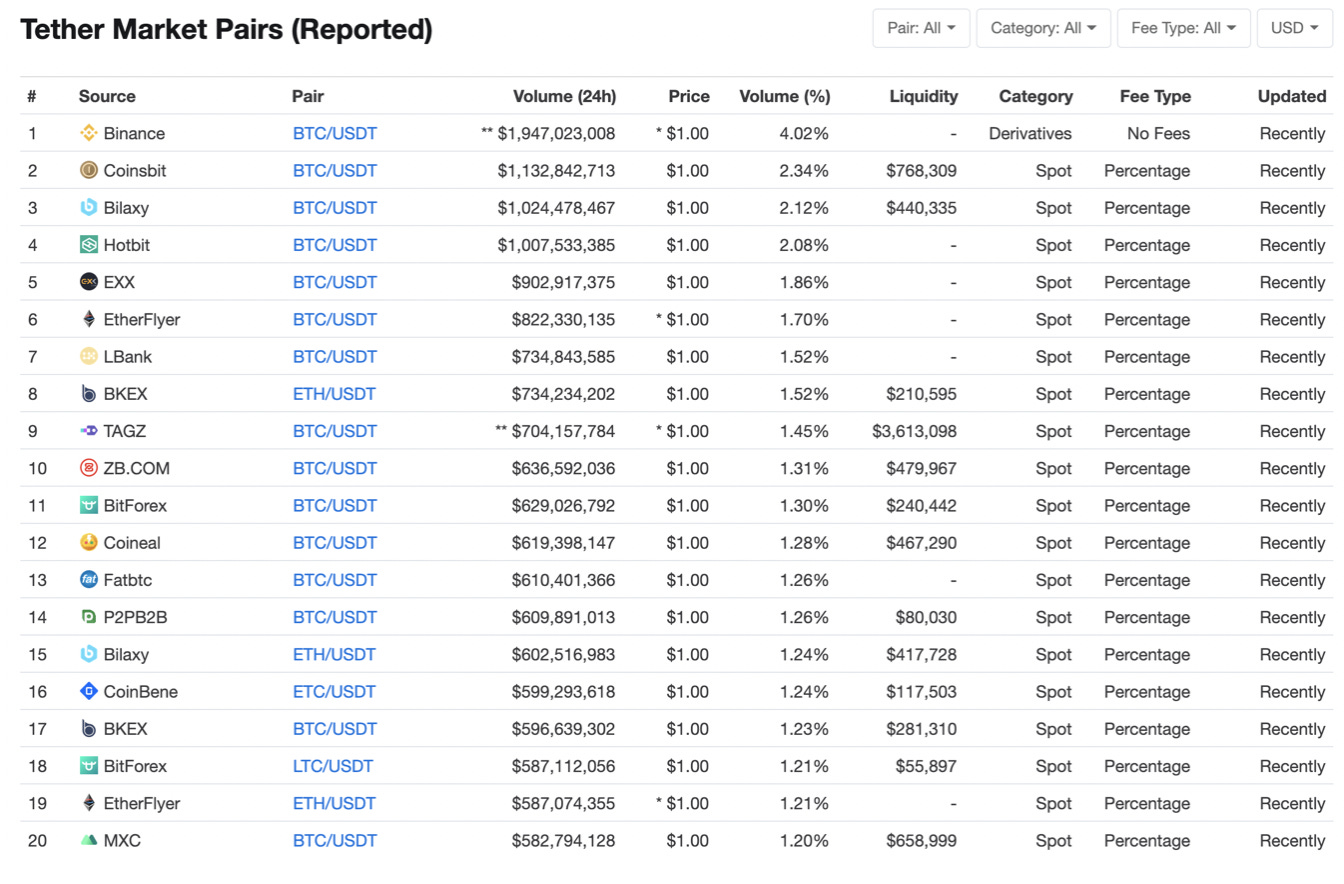
Screenshot: https://coinmarketcap.com/currencies/tether/markets/
If you ask most professional traders if they’ve ever used any of these exchanges, aside from Binance, many will say no. And if we look at the USDT rich list (the wallets that hold the most USDT), again, aside from Binance, none of these exchanges are listed, despite their impressive volume which is unexpected - if they are trading so much USDT they must be holding some large amount of USDT too:

Screenshot: https://usdt.tokenview.com/en/topaccount
It’s also worth noting that there is a very long and storied history involving Tether and its legal issues with how it has maintained its $1.00 USD peg. For the purposes of this article we won’t speculate on either issue - it’s difficult to identify what percentage of trades on the 100s of exchanges that have USDT pairs are fake/wash trades. Regardless of the veracity of the reported data, we believe it is suitable to draw general insights from - if even 10% of USDT’s reported volume is to be believed it still dwarfs the next closest competitor (USDC).
The Thesis:
Tether is a very unique stablecoin due to its issuance process. Because Tether is a fiat collateralized stablecoin it is managed by a centralized entity, Tether Operations Limited, who controls the number of Tethers that are in existence. This makes Tether one of the largest centralized crypto-assets in existence. It’s thought that when Tether Limited creates (or prints) new Tether (which is verifiable on the various blockchains and platforms that support Tether - Omni, Ethereum, EOS, Tron, Liquid, and Algorand) it is a signal of an increase in “new” money into the crypto markets because Tethers are backed by fiat currencies. And “new” money in crypto is considered a ‘bullish’ indicator. Conversely, when Tether Limited removes (or burns) USDT, it is considered a ‘bearish’ indicator because it signals that crypto has been traded into USDT and the USDT has been exchanged for fiat that is leaving the market.
So far in 2020, the market capitalization of Tether has increased by 55.59% (~$2.3b). That’s a lot of new Tether being printed! But before we go too far let’s not forget that Tether only comprises about 4.5% of Bitcoin’s market cap - it’s big but not Bitcoin big.
So the question is, does Tether printing impact BTC prices?
Our Analysis:
The answer is not exactly. There are two ways to think about how Tether printing/burning can impact BTC prices – gradually or immediately:
Gradual impact: Tether printing is of itself not causal to BTC price movements but one of many data points and indicators. As such, any price change to be derived from a change in the USDT supply will happen over time in accordance with other factors.
Immediate impact: Tether printing of a material/significant size signals new, likely “institutional” capital entering a crypto market that has been waiting for institutional participants. This would be a bullish indication that sophisticated investors are entering a market they expect to appreciate in value. As such, BTC prices should react quickly on this news.
Our analysis looked at Tether’s market cap over the past 365 days. As expected, when we evaluate the printing and burning of Tether over time (gradual) and it’s relation to BTC prices, we see a mix of BTC/USDT increases and decreases that could be correlated to Tether but are be near impossible to derive a direct causation link from.
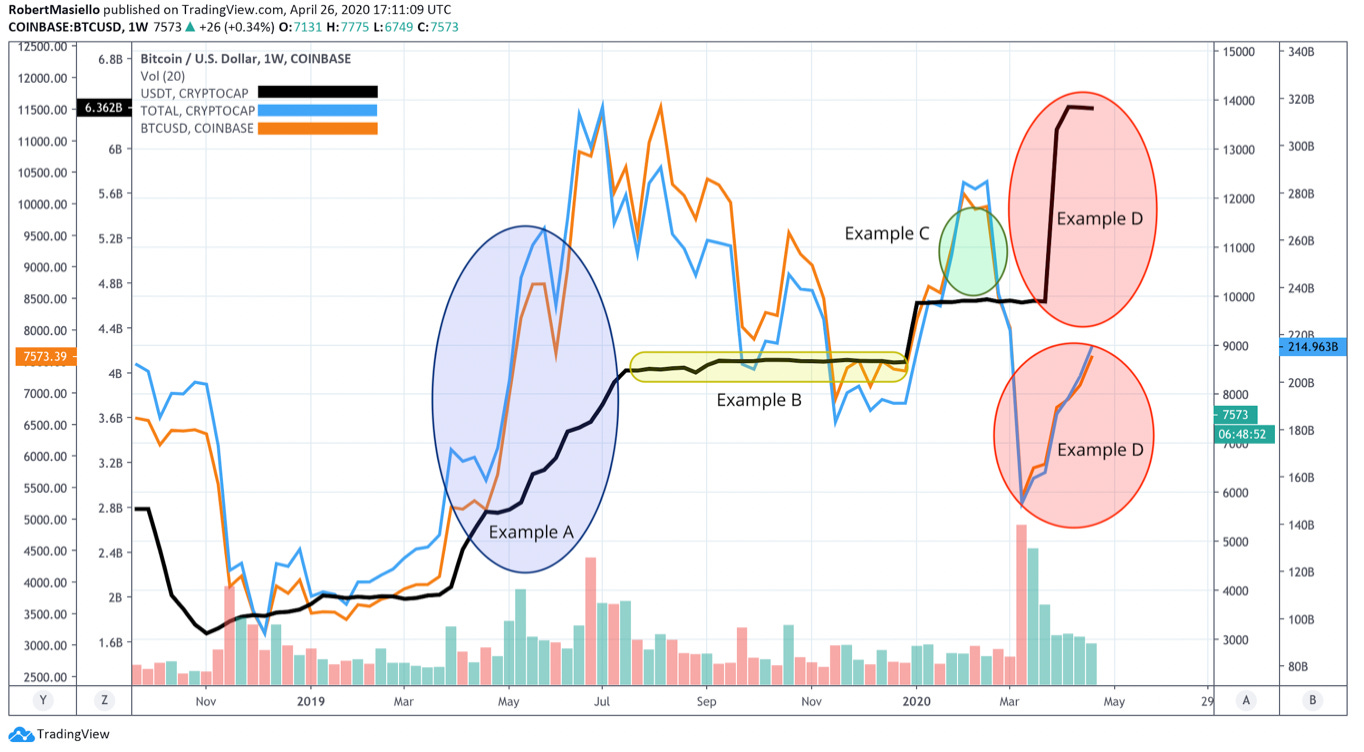
Screenshot: TradingView chart comparing USDT supply to BTC/USD & total crypto market cap. We generally do not use charts for analysis but felt this chart provides simple visual examples of differing Tether-to-BTC prices over time.
Here is a chart that shows exactly this in four situations.
Example A: shows that over time in 2019 USDT was printed and BTC/USD (blue line) dramatically rose.
Example B: we see a mostly flat USDT market cap with a very noisy BTC/USD and overall crypto market cap (orange line).
Example C: we see a rapid increase and decrease in BTC/USD completely devoid of any changes to the amount of Tethers.
Example D: we see a hyperbolic increase in the number of Tethers alongside a substantial increase in BTC/USD.
This tells us that while the price of BTC/USD may be positively or negatively affected by the amount of total Tethers, it is most likely not directly caused due to the printing or burning of Tethers over time. Further, if we were to group Tether supply changes by quarter to evaluate BTC price changes over time, we similarly see no direct link that supply changes positively or negatively impact BTC prices:
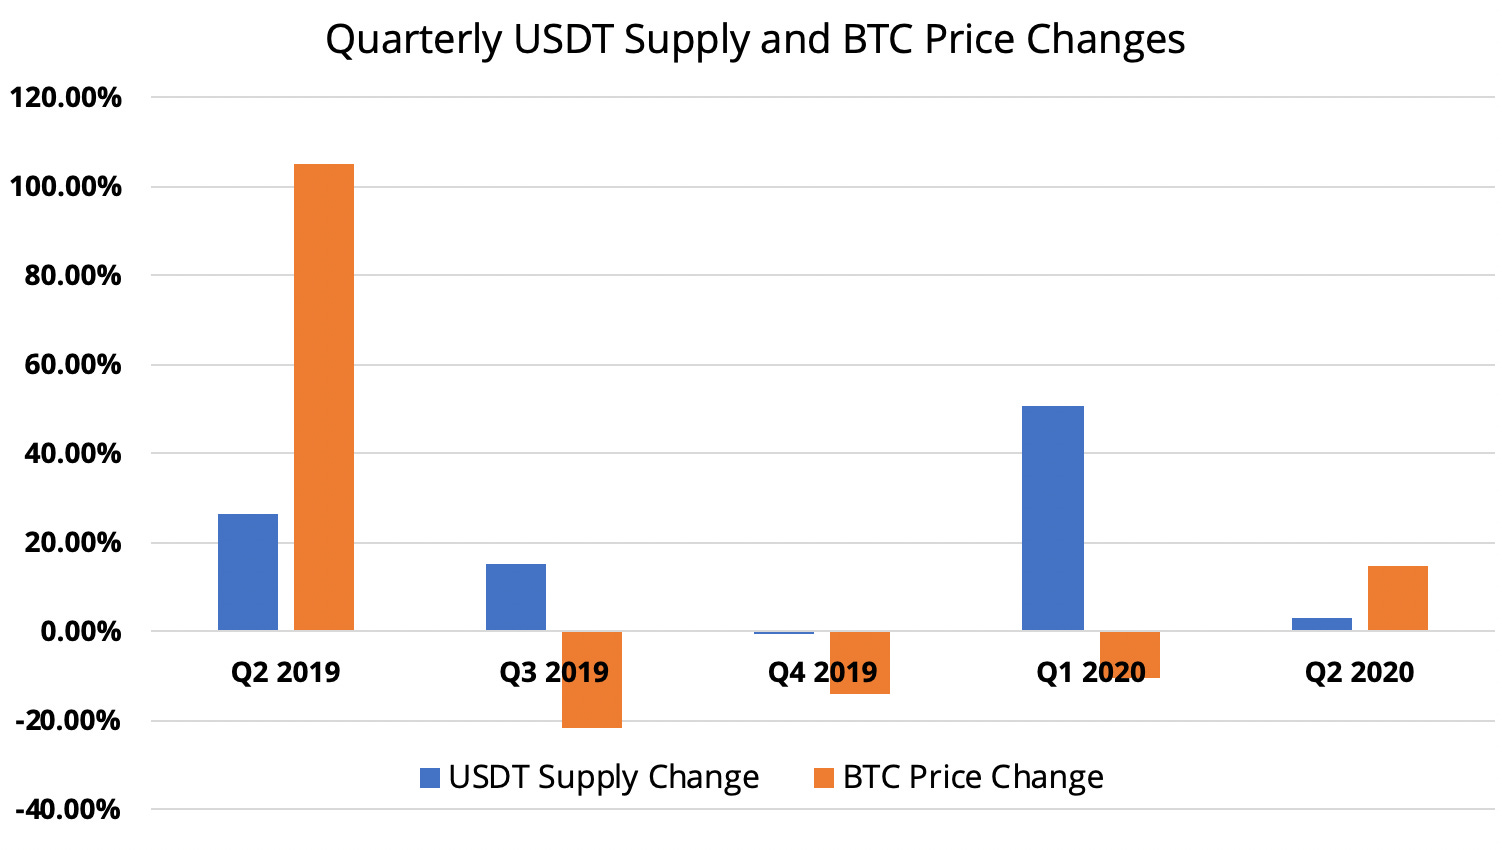
Screenshot: Bar chart comparing quarterly USDT supply changes to BTC/USD percent changes.
As evident by this bar chart, we can see multiple instances where Tethers were printed and BTC prices both increased as decreased. To reiterate, this is mostly expected - USDT supply changes over time could impact BTC prices, but it is likely just another data point and not a leading indicator of some big macro event unfolding.
So what about directly after Tethers or printed or burned? Is Tether a leading indicator? A signal that new institutional participants or “whales” are making moves? To answer this, we looked to identify 24 hour periods where Tether’s reported market cap increased a material amount and how that impacted BTC prices over the following time periods:
24 hours later
72 hours later
7 days later
14 days later
We chose to use 24 hour periods as the measure for Tether market cap change as we wanted to evaluate the impact/shock BTC prices experienced immediately following an instantaneous change in USDT market cap.
What we found was that within a calendar year, 89% of the time (24 hour trading periods) the market cap of USDT changed (grew or shrunk) by less than -/+1%. The average BTC/USDT price change during these time periods was, unsurprisingly, insignificant as well with an average BTC/USDT percent change across each of the four time periods of less than -/+1%.
11% of the time the USDT market cap did increase a material change of more than -/+1% day over a 24 hour period. Further, there were only 3 individual days of new Tethers printed (added to the supply) impacting the existing supply (market cap) by more than 5%. Of those 3 days, BTC/USDT prices changed quite dramatically in both directions. A 5% new Tether print on March 11th, 2020 yielded a near -60% 24 hour impact on BTC/USDT, while a 24.45% new Tether print on March 30th, 2020 yielded only a 0.14% 24 hour increase and a 6% 14 day increase to BTC/USDT. From our analysis, both Tethers being burned as well as being printed have led to price increases to BTC/USDT across all four of our time periods. Our analysis did not show a major latent delay to BTC prices when Tethers are printed. This data is summarized in the following bar chart:
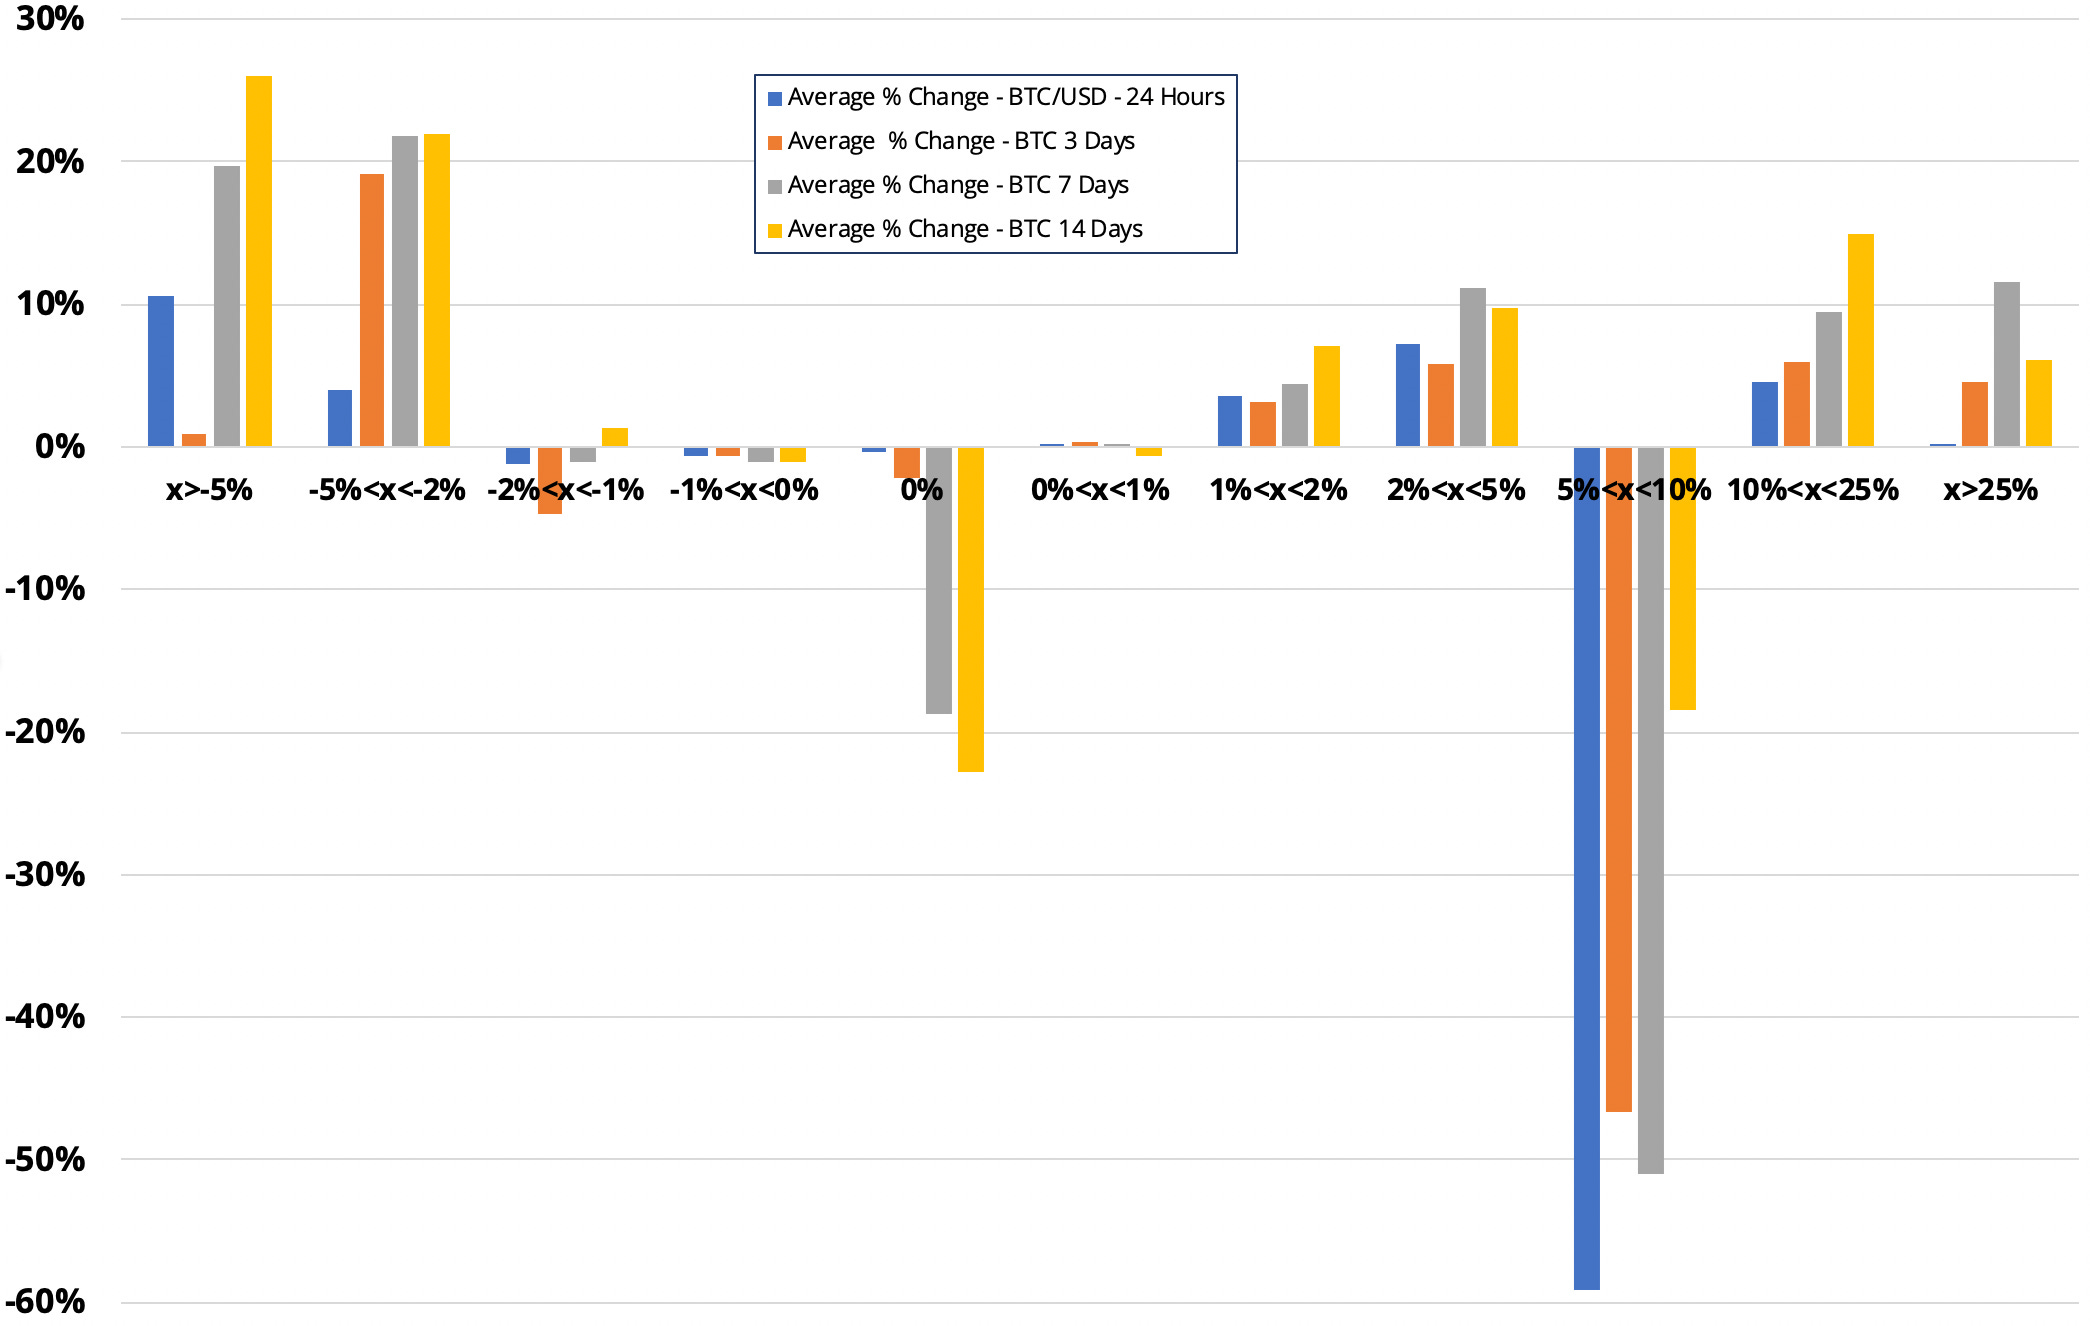
Screenshot: Bar chart comparing daily USDT supply changes grouped by the 24-hour percentage change to BTC/USD percent changes across various time horizons
Closing Thoughts:
After writing this article, we came across a recent study “Stable coins don't inflate crypto markets” by Richard K Lyons and Ganesh Viswanath-Natraj. In the study, the authors also came to similar conclusions that Tether issuance on its own is not a causal link to increasing BTC prices. As with many things in crypto, due to the global nature of space and the increasingly varied market participants, it is unwise to look at singular data points and signals as a single source of truth - you must use such information in a holistic manner to make informed decisions.
14-day Crypto-to-Traditional Asset Correlation Snapshot
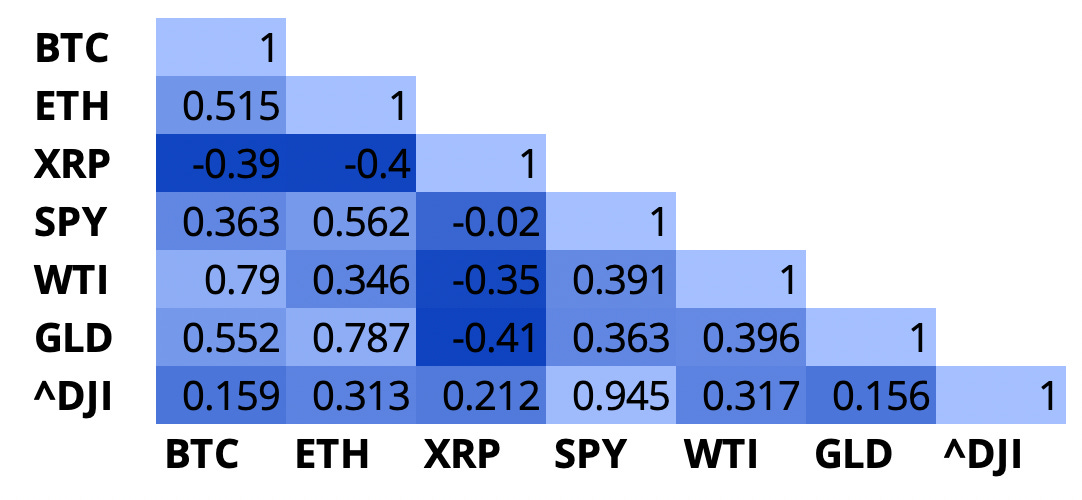
14-day correlation matrix of major cryptos compared to traditional assets indexes. Compare to the April 15 matrix here.

How can we make these newsletters more valuable to you? We’d love to hear your feedback. Connect with us by email or in the comments.
If you found this newsletter interesting, please consider sharing it, thank you.
Disclaimer: This newsletter and article is in no way intended to provide financial advice or a recommendation of investment in any technology, virtual currency, cryptocurrency, or any financial asset. This article is for educational purposes only.